MyWebsite
National Football League Data Analysis
In this project I processed diverse datasets and constructed graphs to visualize the performance of players and teams in the National Football League (NFL) using Google Colab.
This project uses data from the Python library nfl_data_py. Here is a link to the library documentation: nfl_data_py.
The project itself was split into 4 smaller projects along with many miscellaneous graphs:
- Weekly and Yearly Team Rankings
- Matchup Calculator
- Visual Game Breakdown
- Win Percentage Breakdown
- Miscellaneous Graphs
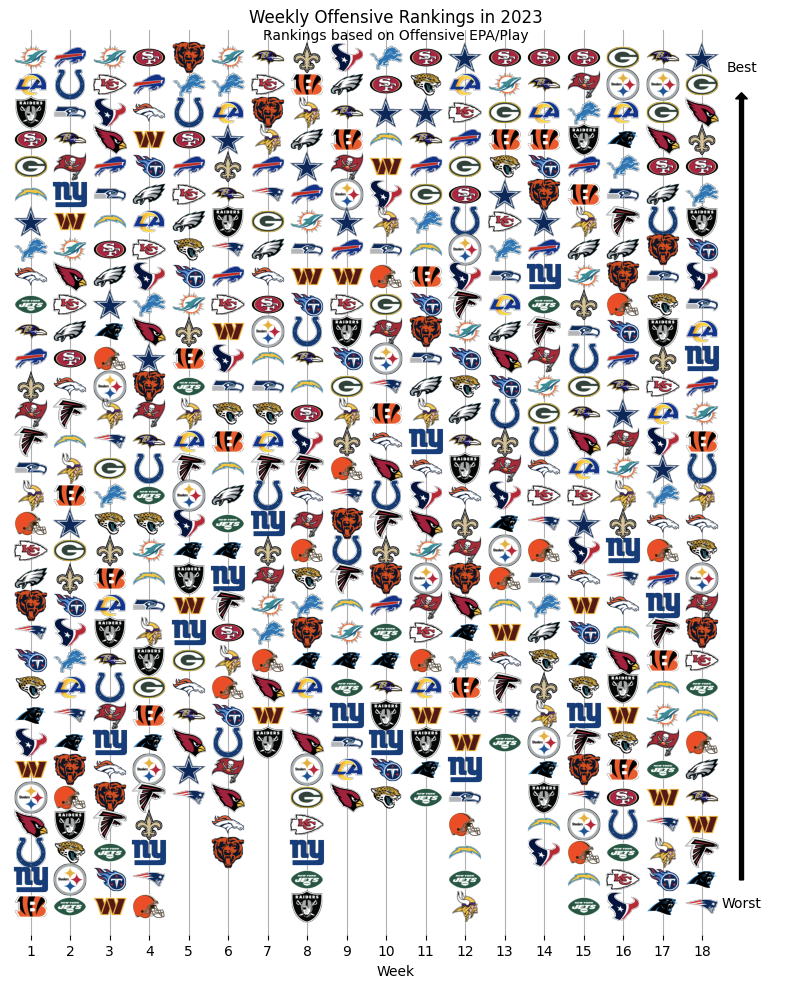
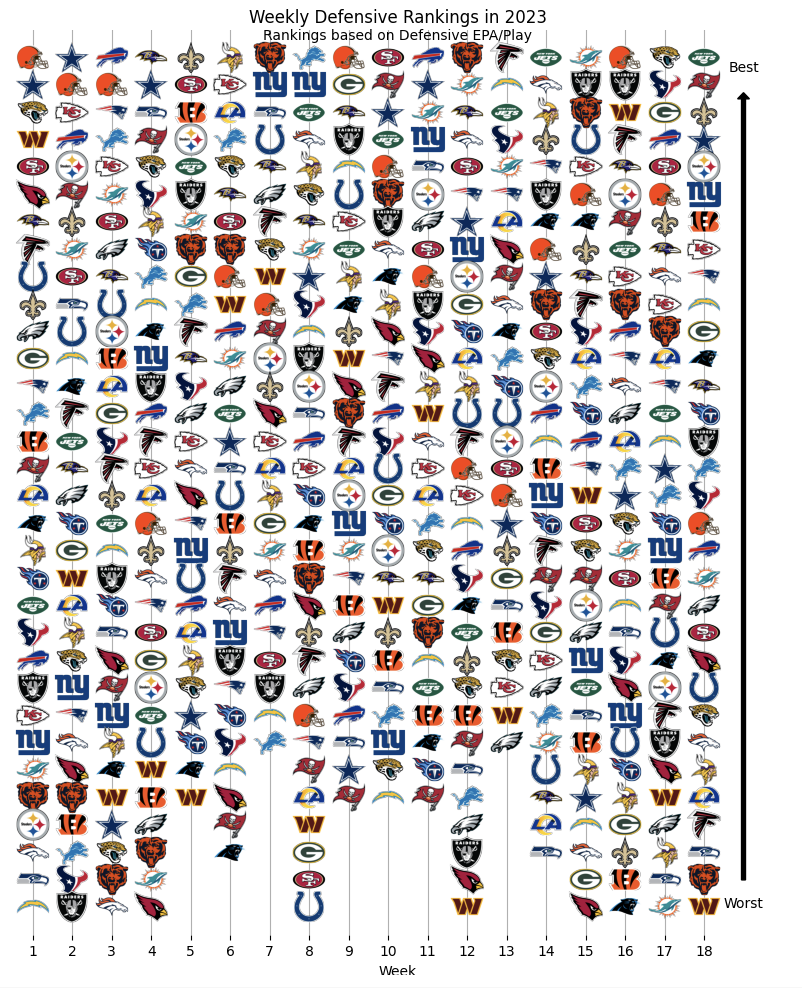
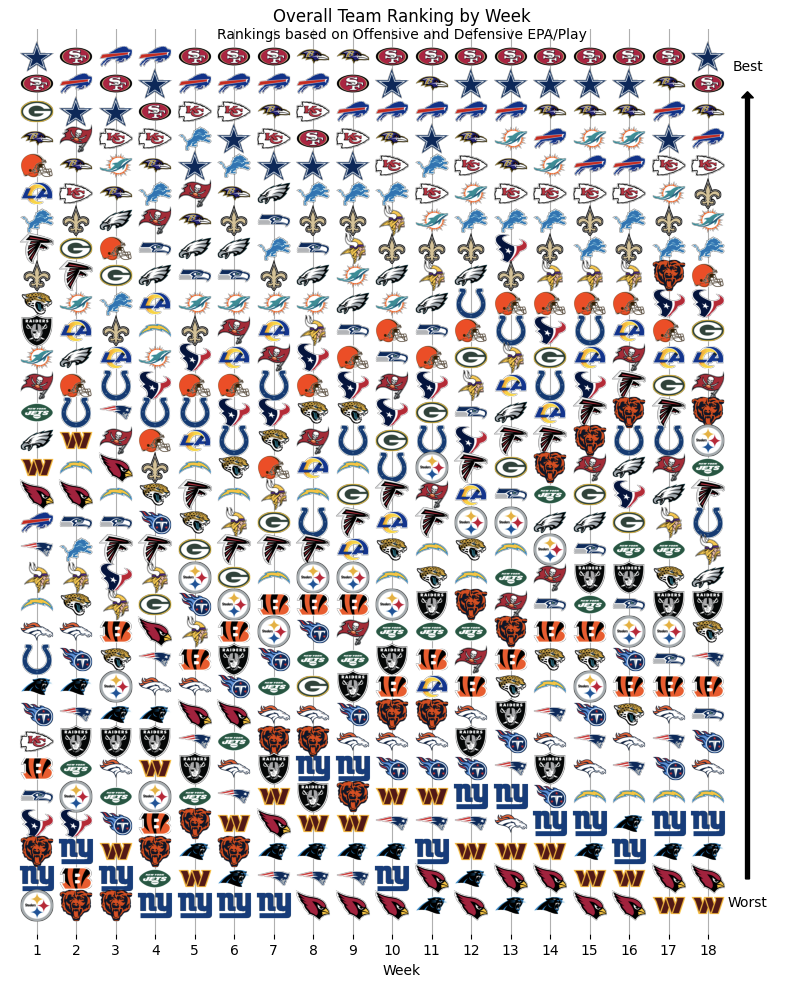
Weekly and Yearly Team Rankings
This sub-project involves using general data from the 2023 NFL season to objectively track the rankings of teams based on EPA/play (Expected points added per play) on Offense, Defense, and Overall.
EPA/play is basically how successful a given play is where a positive number is good and and a negative number is bad.
The data for the Weekly Team Rankings chart is independent for each week (where each week is one game). In games where the team has a bye week (the team did not play), they where removed from the week.
The data for the Yearly Team Rankings chart is dependent on the previous weeks and so the EPA/play is added each week.
Below are a few example charts:
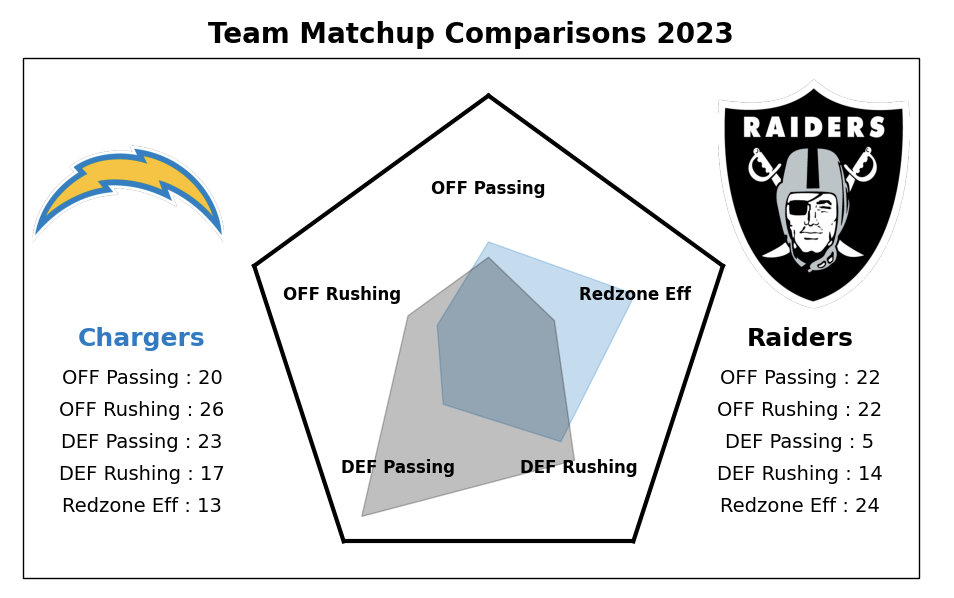
Matchup Calculator
This sub-project involves using 2023 NFL data to compare multiple factors of two teams such as: Ability to rush, ability to defend the rush, ability to pass, ability to defend the pass, and ability to score touchdowns when in the Redzone (20 yards or closer to the endzone). The data also uses EPA/play to measure each teams ability in each rushing and passing category. Before the chart is printed, the user is requested to enter two teams. The numbers under each teams logo is that teams rank in each category out of 32 teams. The larger the area corresponds to a better overall team. Below is an example comparison between the Los Angeles Chargers and the Las Vegas Raiders.
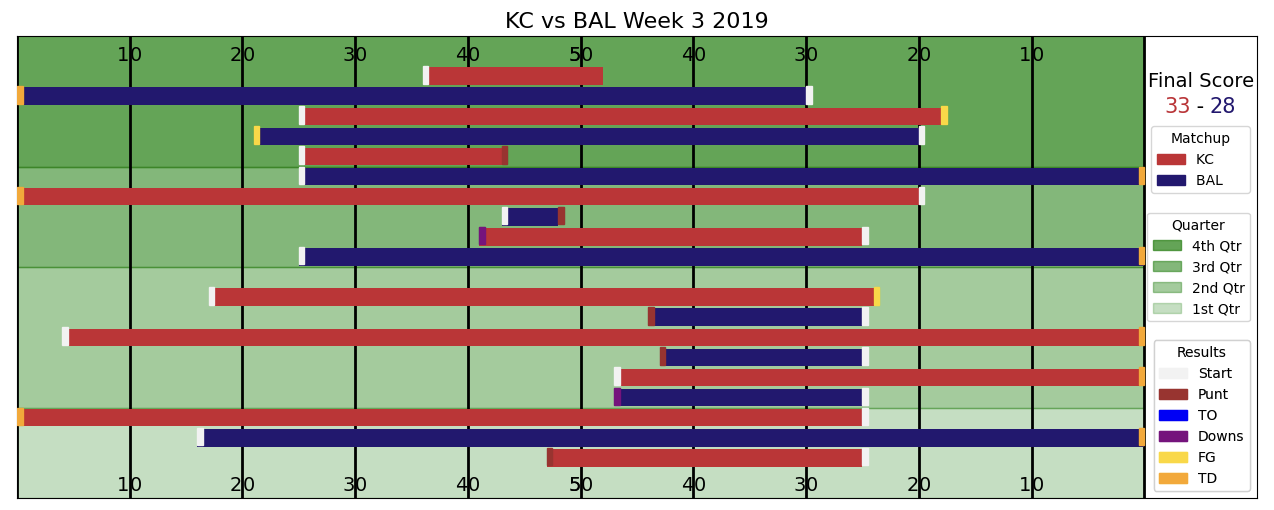
Visual Game Breakdown
This sub-project is a tool to visualize the game flow of any NFL game (Regular season or playoffs) since 2000. The user is prompted to enter in two teams and a year they played. If the teams played multiple times that year the user is then prompted to select the specific game. Below is an example of a game between the Kansas City Chiefs and the Baltimore Ravens in Week 3 of the 2019 season.
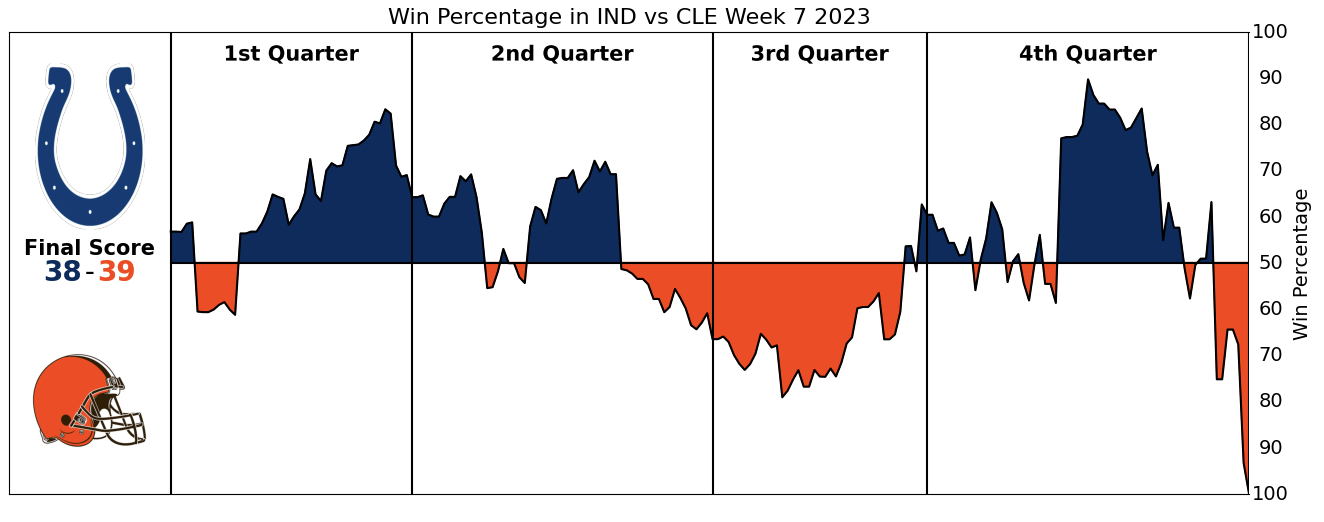
Win Percentage Breakdown
This sub-project is intended to visualize the win percentage of past NFL games. Similarly to the Visual Game Breakdown, the user is prompted to enter a past game. Below is an example of a game between the Cleveland Browns and the Indianapolis Colts in Week 7 of the 2023 Season.
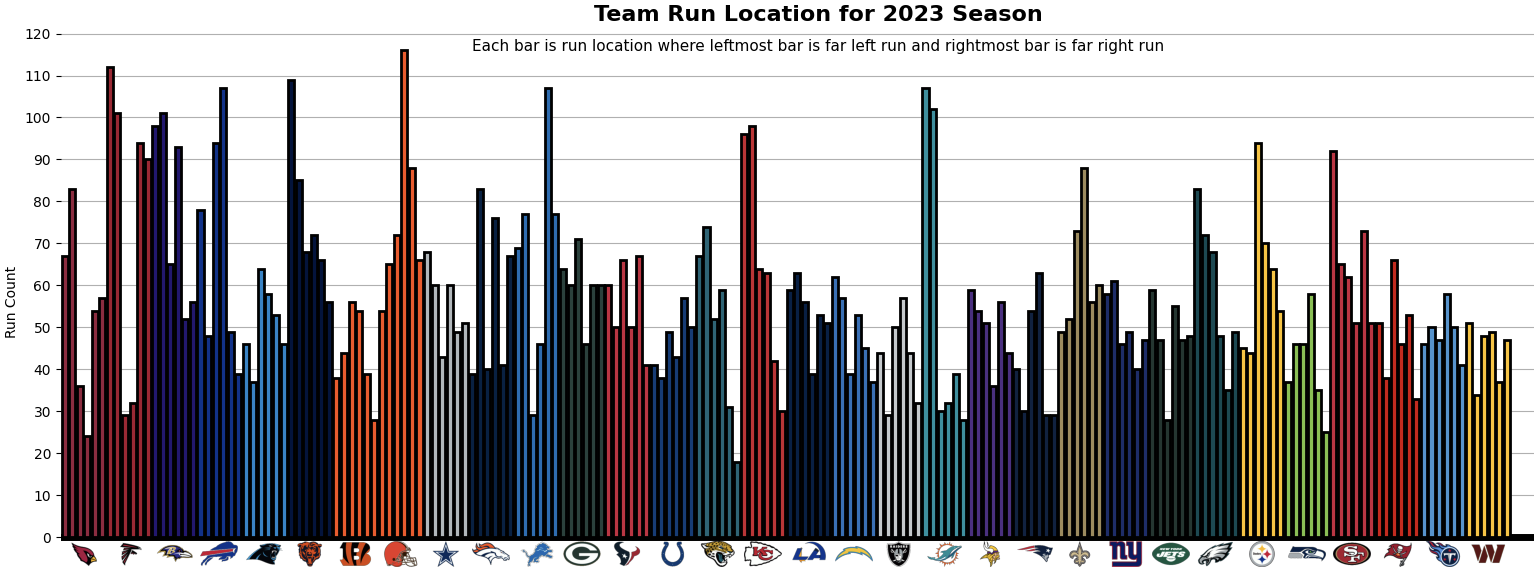
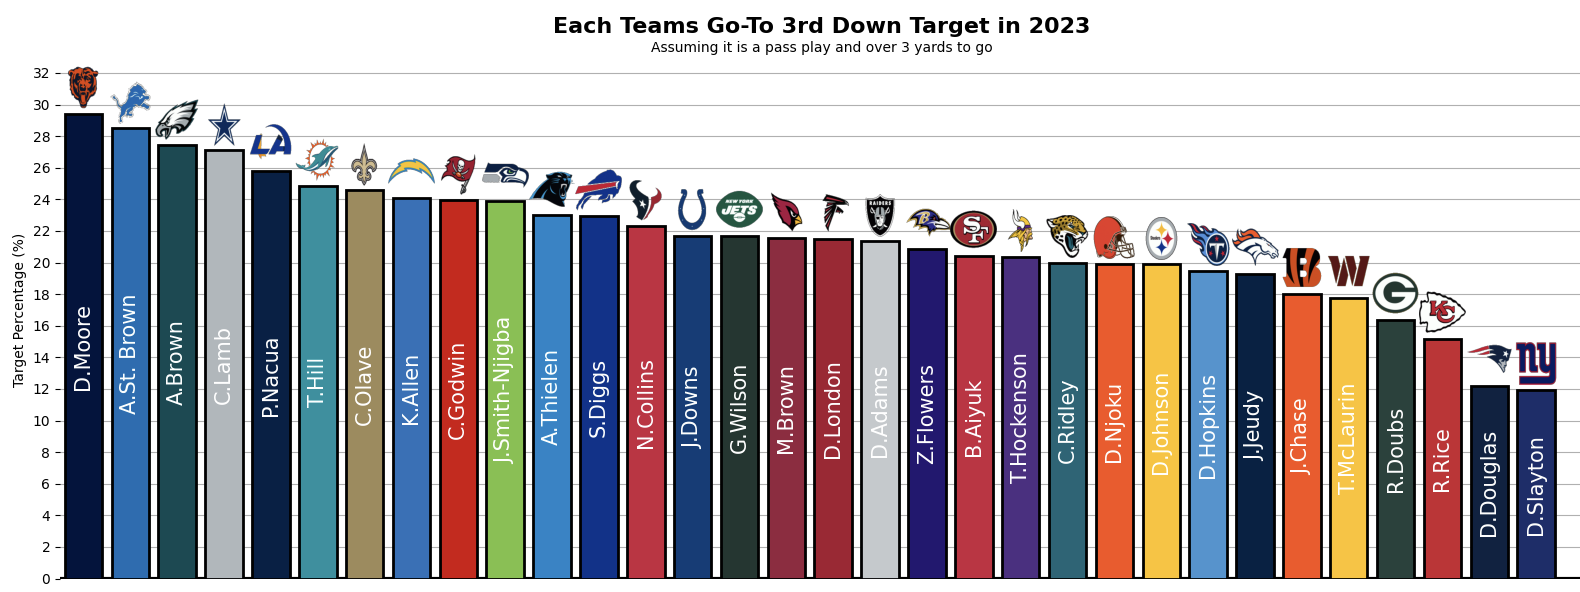
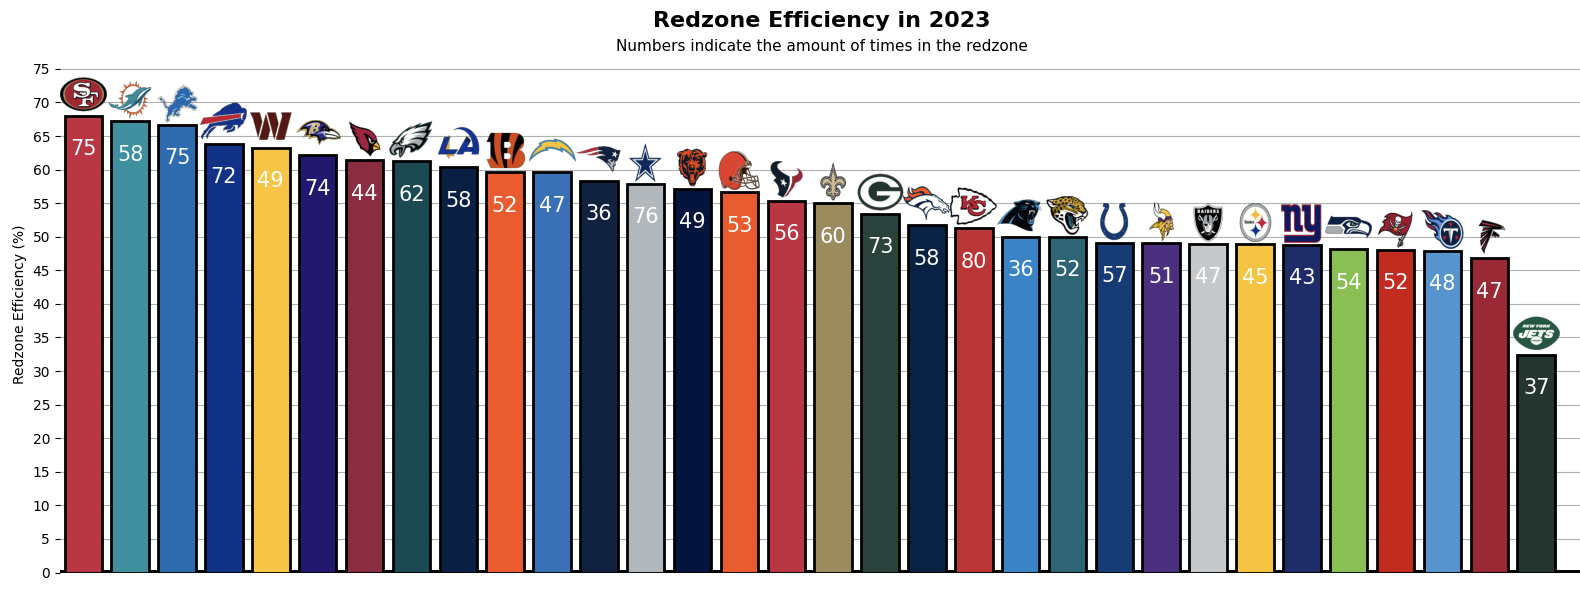
Miscellaneous Graphs
Aside from the other defined projects I created many other single graphs to analyze specific trends and players. Below is a few examples of these graphs: